
Measurement
Part of How to run B2B influencer marketing measurement without guesswork
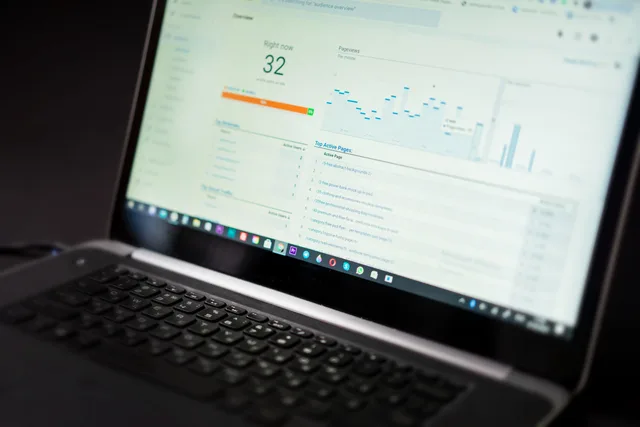
A B2B influencer marketing reporting dashboard should answer one question
Set up a B2B influencer marketing reporting dashboard around one decision, with fixed metrics, named owners, labelled pound figures and UK GDPR checks.
What to take away
- Decide which question the dashboard must answer before you choose a metric.
- Keep three viewsboard, campaign and delivery, each with a named owner.
- Print the metric definition, data source and refresh date beside every number.
- Separate reach and engagement from pipeline influence, and label both clearly.
- Confirm your lawful basis for handling creator and contact data before launch.
The decision behind the dashboard
Every dashboard answers a question someone senior is already asking. If you cannot name that question, you will build a wall of charts nobody opens. Write the question at the top of the page in plain words.
For most UK B2B teams the question is whether to keep the creator programme running. That framing decides what you measure. A keep-or-stop call needs cost, reach inside the target buying group, and evidence of influence on live deals.
The market you are reaching is worth sizing at the same time. GOV.UK's business population estimates 2023 counted about 5.6 million private sector businesses in the UK, which is a reminder that a precise audience definition beats a large one.
Agree what counts as influence before you design the page. B2B influencer marketing measurement and reporting sets out the method this dashboard sits inside, including how to treat correlation without overclaiming.
Your minimum metric set
Hold six to eight metrics and resist adding more. A workable set covers cost, audience reach, engagement quality and pipeline influence. Every metric needs a definition, a source and an owner.
Minimum Metric Set
- Cost
- Audience reach
- Engagement quality
- Pipeline influence
- Definition, source, owner per metric
- One reporting window
Avoid metrics that measure the same thing twice. Impressions, reach and views overlap heavily, so pick one and define it precisely. State the reporting window too, so nobody compares a seven-day figure with a 30-day one.
Reach means little without a denominator. If the programme targets finance directors at mid-sized manufacturers, report reach as a share of that group, not as a share of the platform.
Platform reporting is not neutral, so treat it as one input among several. LinkedIn's marketing blog covers its own B2B social and creator content guidance, which helps you see what its dashboard numbers do and do not include.
Sources, owners and refresh dates
Each number needs a named source and a named owner. Creator platform exports, your CRM and a short monthly survey can all feed one page. The owner checks the figure before publication, not after.
Set a cadence that matches how often the decision comes round. A quarterly budget review does not need daily data. A live campaign review probably needs weekly numbers.
Personal data is the part teams underestimate. Creator contacts, commenter names and matched CRM records all sit inside UK GDPR, so document a lawful basis and a retention period before the first export. Restrict access as well, because a page that pulls personal data should not be open to the whole company.
If your headline figures keep shifting, B2B influencer marketing key metrics in England covers the definitions UK teams argue about most, including reach and engagement.
A worked example
Illustrative figures, not a benchmark. A software firm pays six creators £4,000 a month in total. Each creator publishes two posts, so the programme buys 12 posts at about £333 each.
Reach is reported against a named list of 2,000 target accounts. The month produces 140 engagements from people at those accounts, plus 18 influenced opportunities with £90,000 of pipeline attached.
Cost per engaged account is about £29. Cost per influenced opportunity is about £222. Put both beside the same figures for paid search and events, and the keep-or-stop decision becomes arguable.
Common questions
How many metrics should the dashboard show?
Six to eight is enough for a monthly review. Beyond that, readers skim and the review loses its point.
Should we buy a BI tool for this?
Only if someone maintains it. A plain spreadsheet with clear owners beats a dashboard nobody refreshes.
Who owns the numbers?
One person per metric. Shared ownership usually means nobody checks the figure before it travels.
How often should we refresh it?
Match the cadence of the decision. If the budget review is quarterly, quarterly data is sufficient.